Phase Diagrams
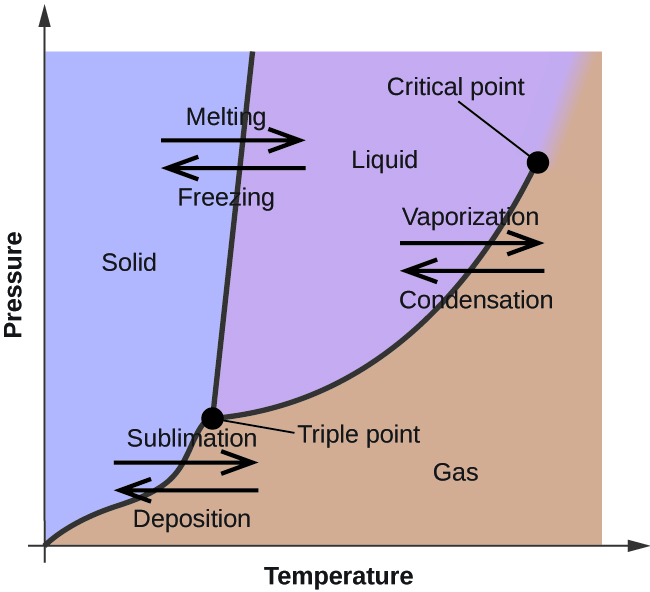
These diagrams show the state of an element or molecule depending on the temperature and pressure. The melting and boiling points both vary with temperature and pressure. Most often, the "normal" melting and boiling points occur at around 1 atm (1 atmosphere of pressure or 101.3 kpa).
Triple & Critical Points
Typically, elements/molecules have both a triple and a critical point. At triple points, the element or molecule is in all 3 phases at once (solid, liquid, and gas). When it comes to the critical point, however, a substance becomes both a liquid and a gas.
The names for the different state transitions are shown above, such as melting/freezing, vaporization/condensation, and sublimation/deposition.
Vapor Pressure
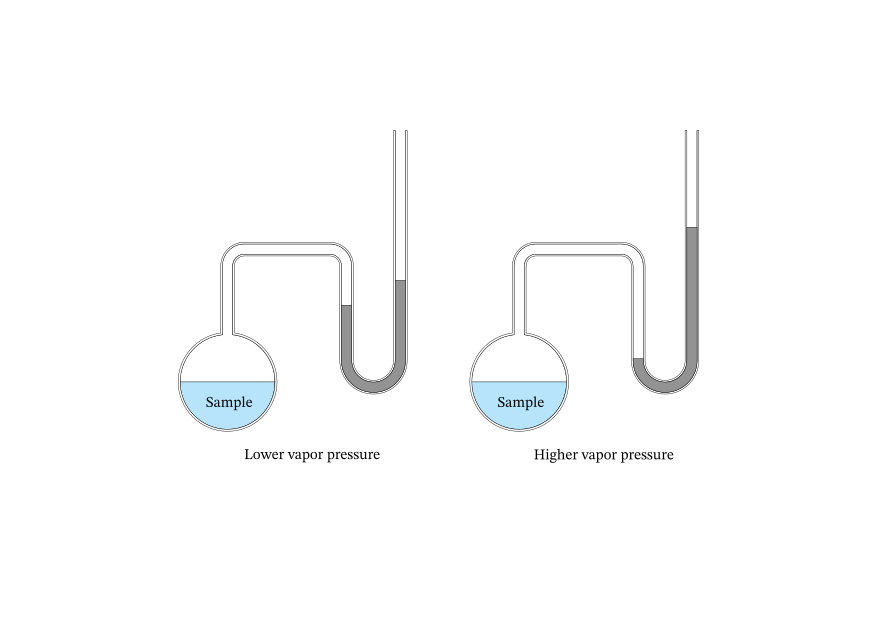
In most liquids, there's always a fraction of molecules that will evaporate. This evaporated liquid (now a gas) will form a layer of vapor around the rest of the liquid.
Some liquids are volatile, meaning they evaporate quickly, are flammable, and have high vapor pressure. Having a higher vapor pressure means that it's easier to go from a liquid to a gas. They also have lower boiling points.
Having weak intermolecular forces makes it easier for a liquid to go to gas, also lowering the boiling point. The boiling point is where -
- Vapor pressure = Atomospheric pressure